Analytics: FIFA World Cup Data
For this project I analyzed data from the FIFA World Cups between 1930 and 2014. This tournament is an international football competition where countries qualify to send teams made up of the best players from each nation to obtain the World Cup Championship. It has been awarded every four years since the inaugural tournament in 1930, except in 1942 and 1946 when it wasn’t held due to the Second World War. The current format of the tournament involves 32 teams competing for the title at venues within the host nation over a period of one month.
Throughout the project you will be able to find:
- Data cleaning and standardization of countries names.
- Analysis of World Cup Winners 1930 - 2014.
- Visualization of matches played and teams qualified per World Cup over the years.
- Analysis of the distribution of goals per match.
- Analysis of average and total goals scored for an specific team throughout its World Cup participations.
Datasets and Technologies Used
The analysis was done with two csv files from Kaggle. ‘WorldCups.csv’ contains information of each World Cup played, the year it was hosted, the country who won, the runner-ups, the number of goals scored, qualified teams, matches played and the total attendance. On the other hand, ‘WorldCupMatches.csv’ contains information of each match played on the World Cups including the year, stage, stadium, city, home and away teams and the numbers of goals scored.
In terms of technologies, python was used for the data analysis with the following tools: pandas for data tyding and manipulation, numpy for numerical analysis and matplotlib and seaborn for plots and graphs.
Data Analysis
World Cups 1930 - 2014
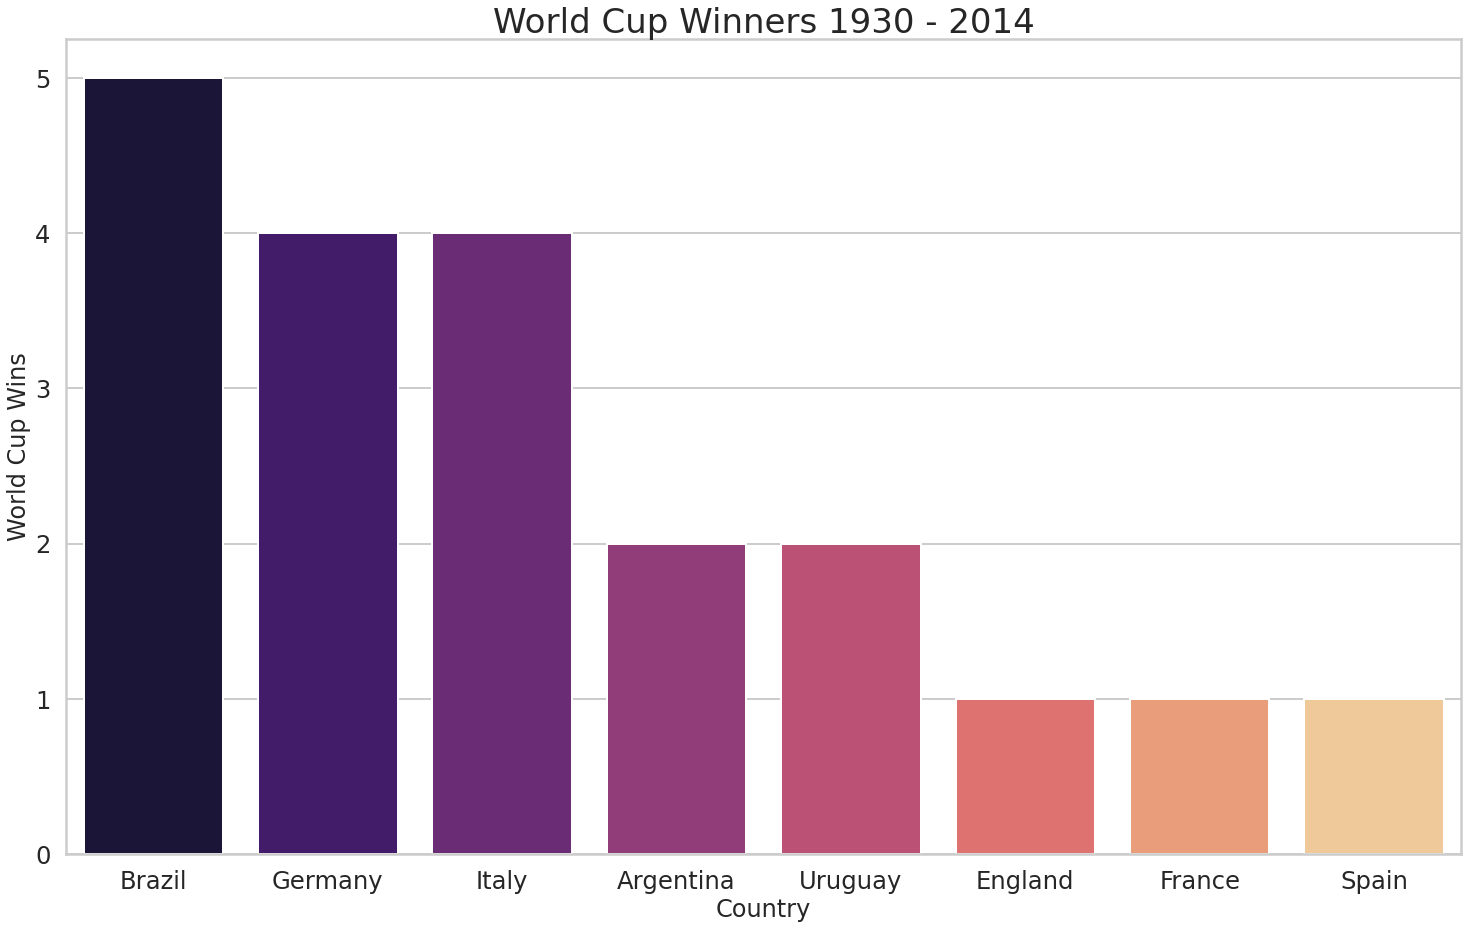
Figure 1: World Cup Winners 1930 -2014
There are 8 different countries (10.12%) that have been able to raise the World Cup Trophy from the 79 countries that have participated throughout the history of the tournament. From them Brazil (1958, 1962, 1970, 1994, 2002), Germany (1954, 1974, 1990, 2014) and Italy (1934, 1938, 1982, 2006) not only have won 65% of the time but also lead the number of appearances in the tournament (21, 19 and 18 respectively) and the number of matches played (109, 109 and 83 respectively).
As can be seen in the graphs below there has been drastic changes in the number of teams qualified to the World Cup over the years along with, the number of matches played per tournament. The format that is currently used started in 1998 where 32 teams classify and are divided into 8 groups of 4 teams each and 64 matches are played in total. The first two teams of each group pass to the the knockout stages where they face a single team in the Round of 16. The one that loses is eliminated and the one that wins advances to Quarter-Finals. The formula is repeated to pass to Semi-Finals and finally to the Final match.
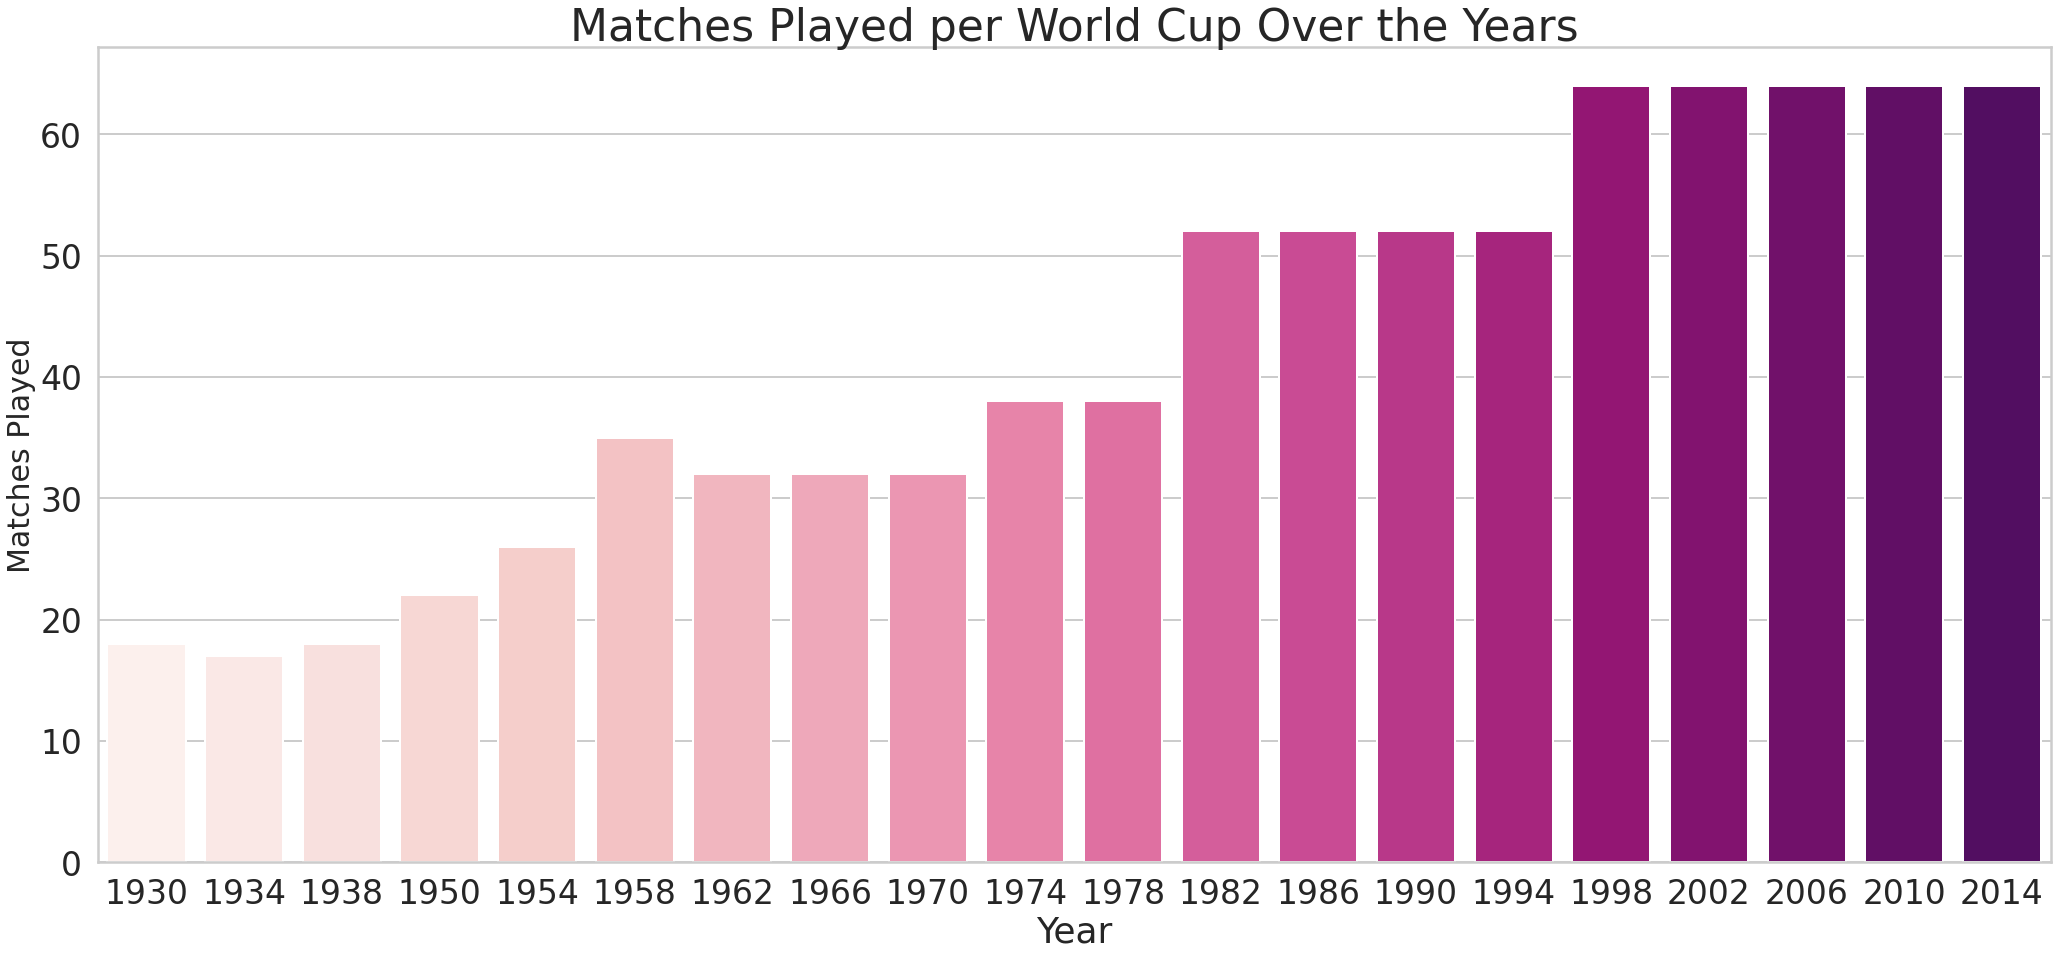
Figure 2: Matches Played per World Cup.
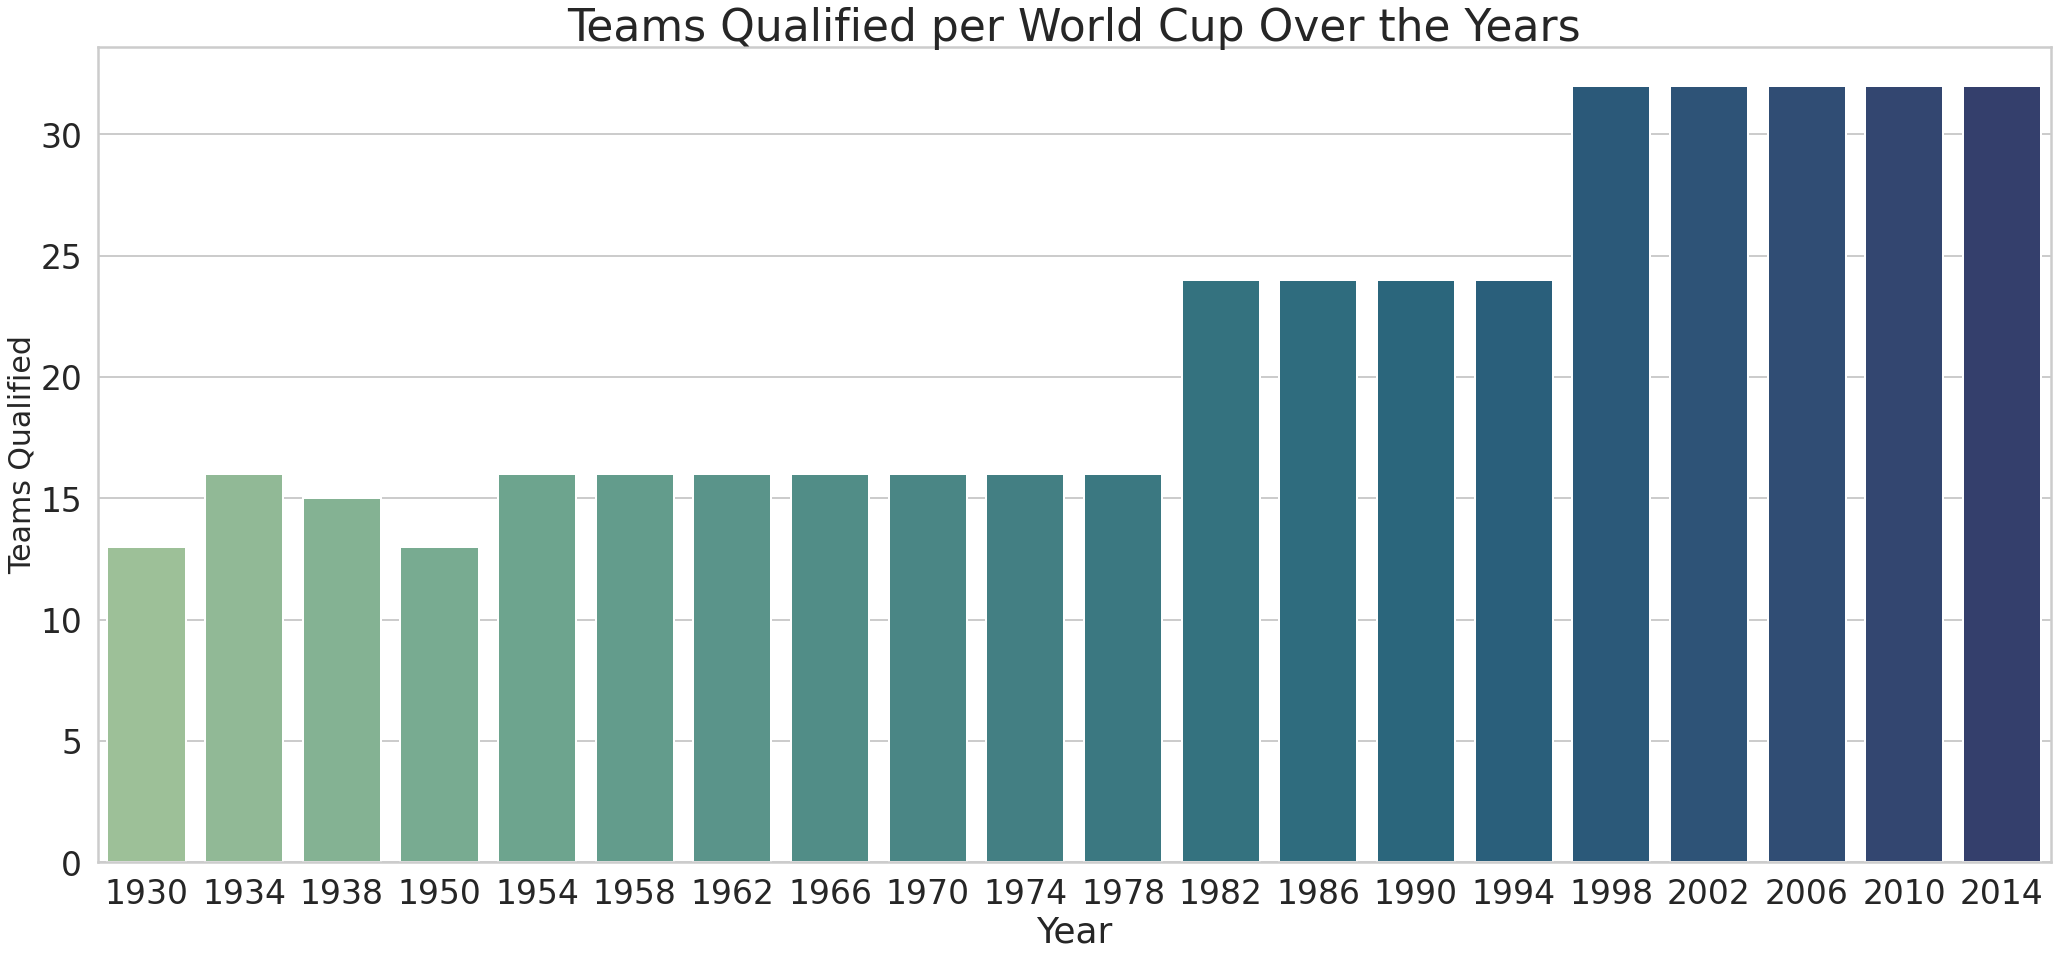
Figure 3: Teams Classified per World Cup.
Goals Scored
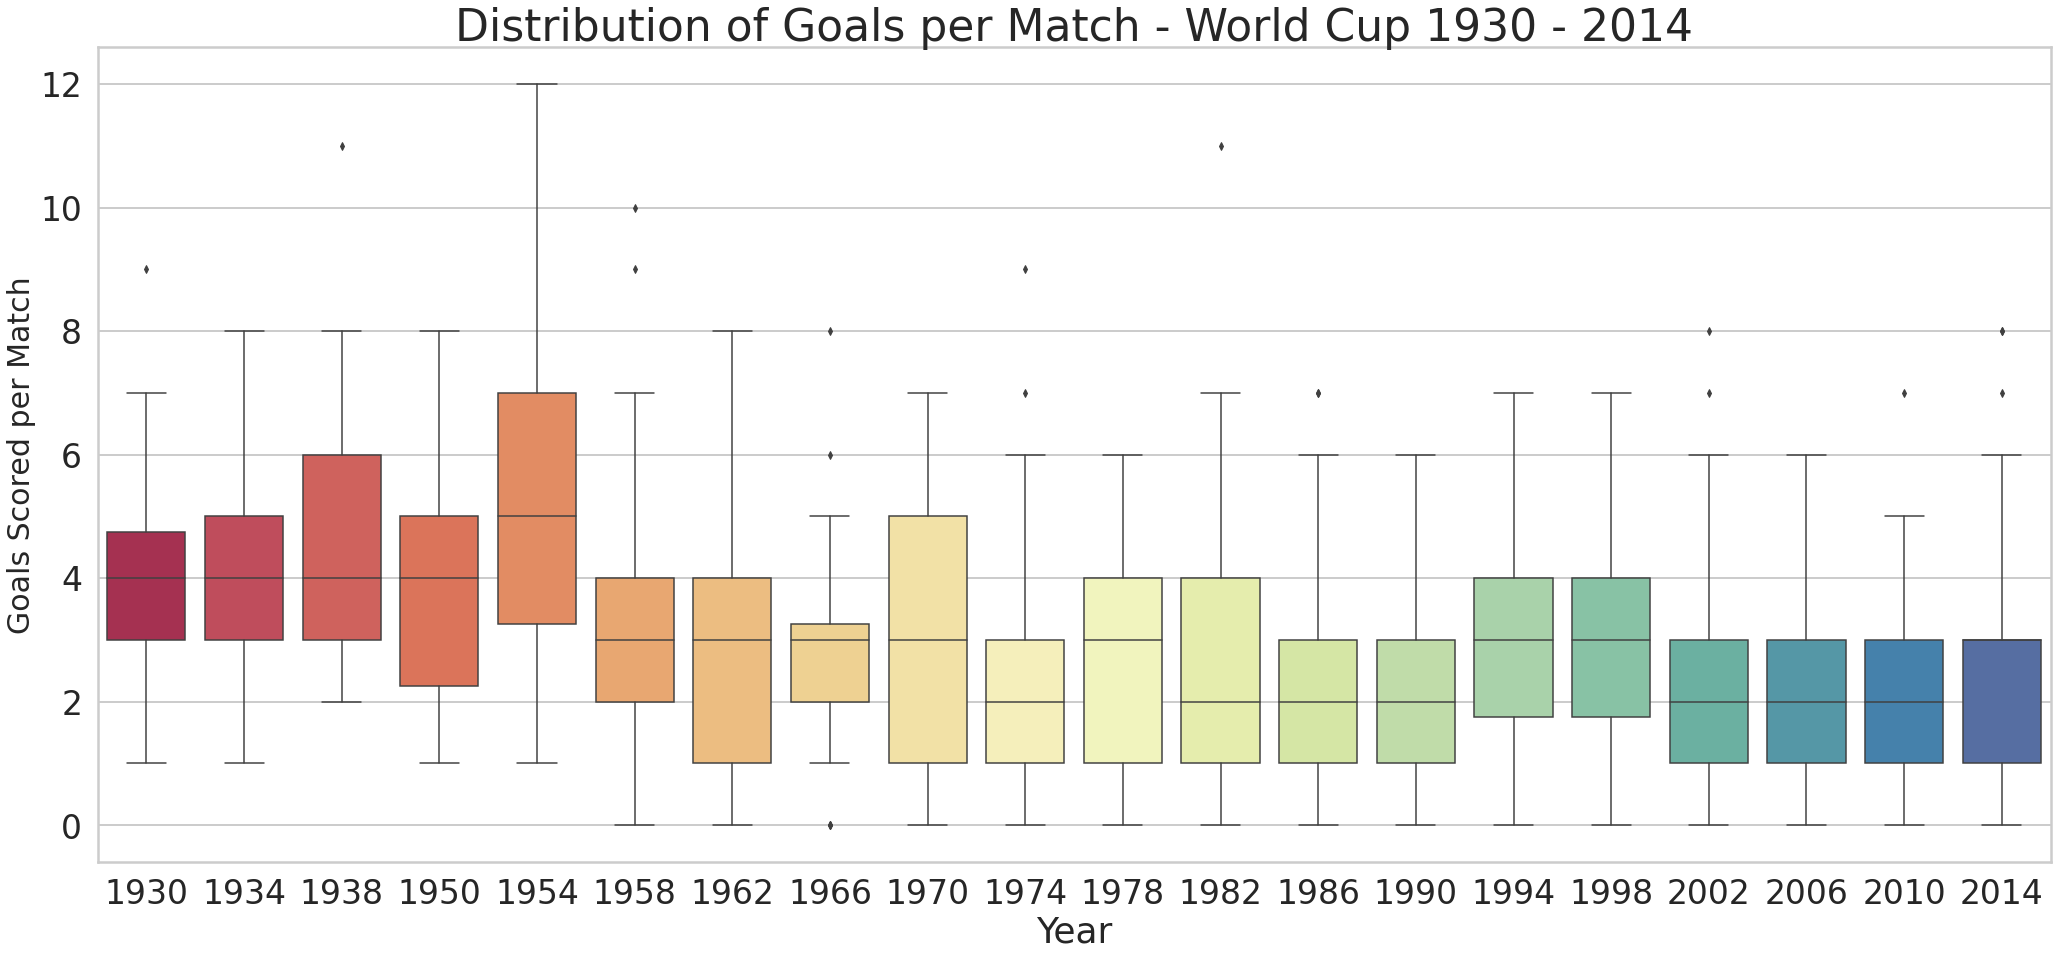
Figure 4: Distribution of Goals per Match.
As the boxplot above shows, the distribution of goals per match has changed over the years. On the first years of the tournament (1930 - 1950) there is a median of 4 goals per match. Taken into account that the median of teams classified to the World Cup was 14, just 44% of the teams that classify nowadays, and the median of matches played was 18, 28% of the matches that are played today, the median numbers of goals per match is high even doubling the World Cups of 2002, 2006, 2010 and 2014. This can be due to the fact, that teams focused their style of play on vertical attack making fast transitions from a defensive position enabling them to create more goal scoring opportunities throughout the game.
The World Cup of Switzerland in 1954 has the highest median of goals per match on record with 5. On this Tournament countries like South Korea, Turkey and Scotland made their debut leading to matches with a high number of goals scored. Hungary 9 - 0 South Korea, Uruguay 7 - 0 Scotland and Turkey 7 - 0 South Korea are a few examples and that is why the Q3 range of the boxplot is so large.
Moving forward, from 1958 to 1994 the median of goals scored per match elapsed from 3 to 2 goals. New countries continue to make their first time appearances on the tournament and even though the number of participating teams from 1982 to 1994 increased to 24 and the number of matches played per tournament increased respectively, the goals scored per match didn’t had a significant variation. This is partly due to the fact, that newcomer teams adopted a defensive style of play, sacrificing their attack, and focusing in preventing goal scoring opportunities.
Finally, from 1998 to 2014 the current format of 32 participating teams and 64 matches played in the tournament was established. The median of goals per match was the highest in 1998 with 3 goals while the rest of the years was 2 goals. Matches became more tactical, the defensive style and counterattacking prevailed leading to tight wins. This is even more evident on knockout matches where, as can be seen on the graph below, the number of goals has decreased over time. Even Brazil who was famous by its attacking play style and joga bonito was influenced by this trend, during this period it only won the World Cup (2002) and nowadays the magic attack that the Brazilian Team had is a thing of the past.
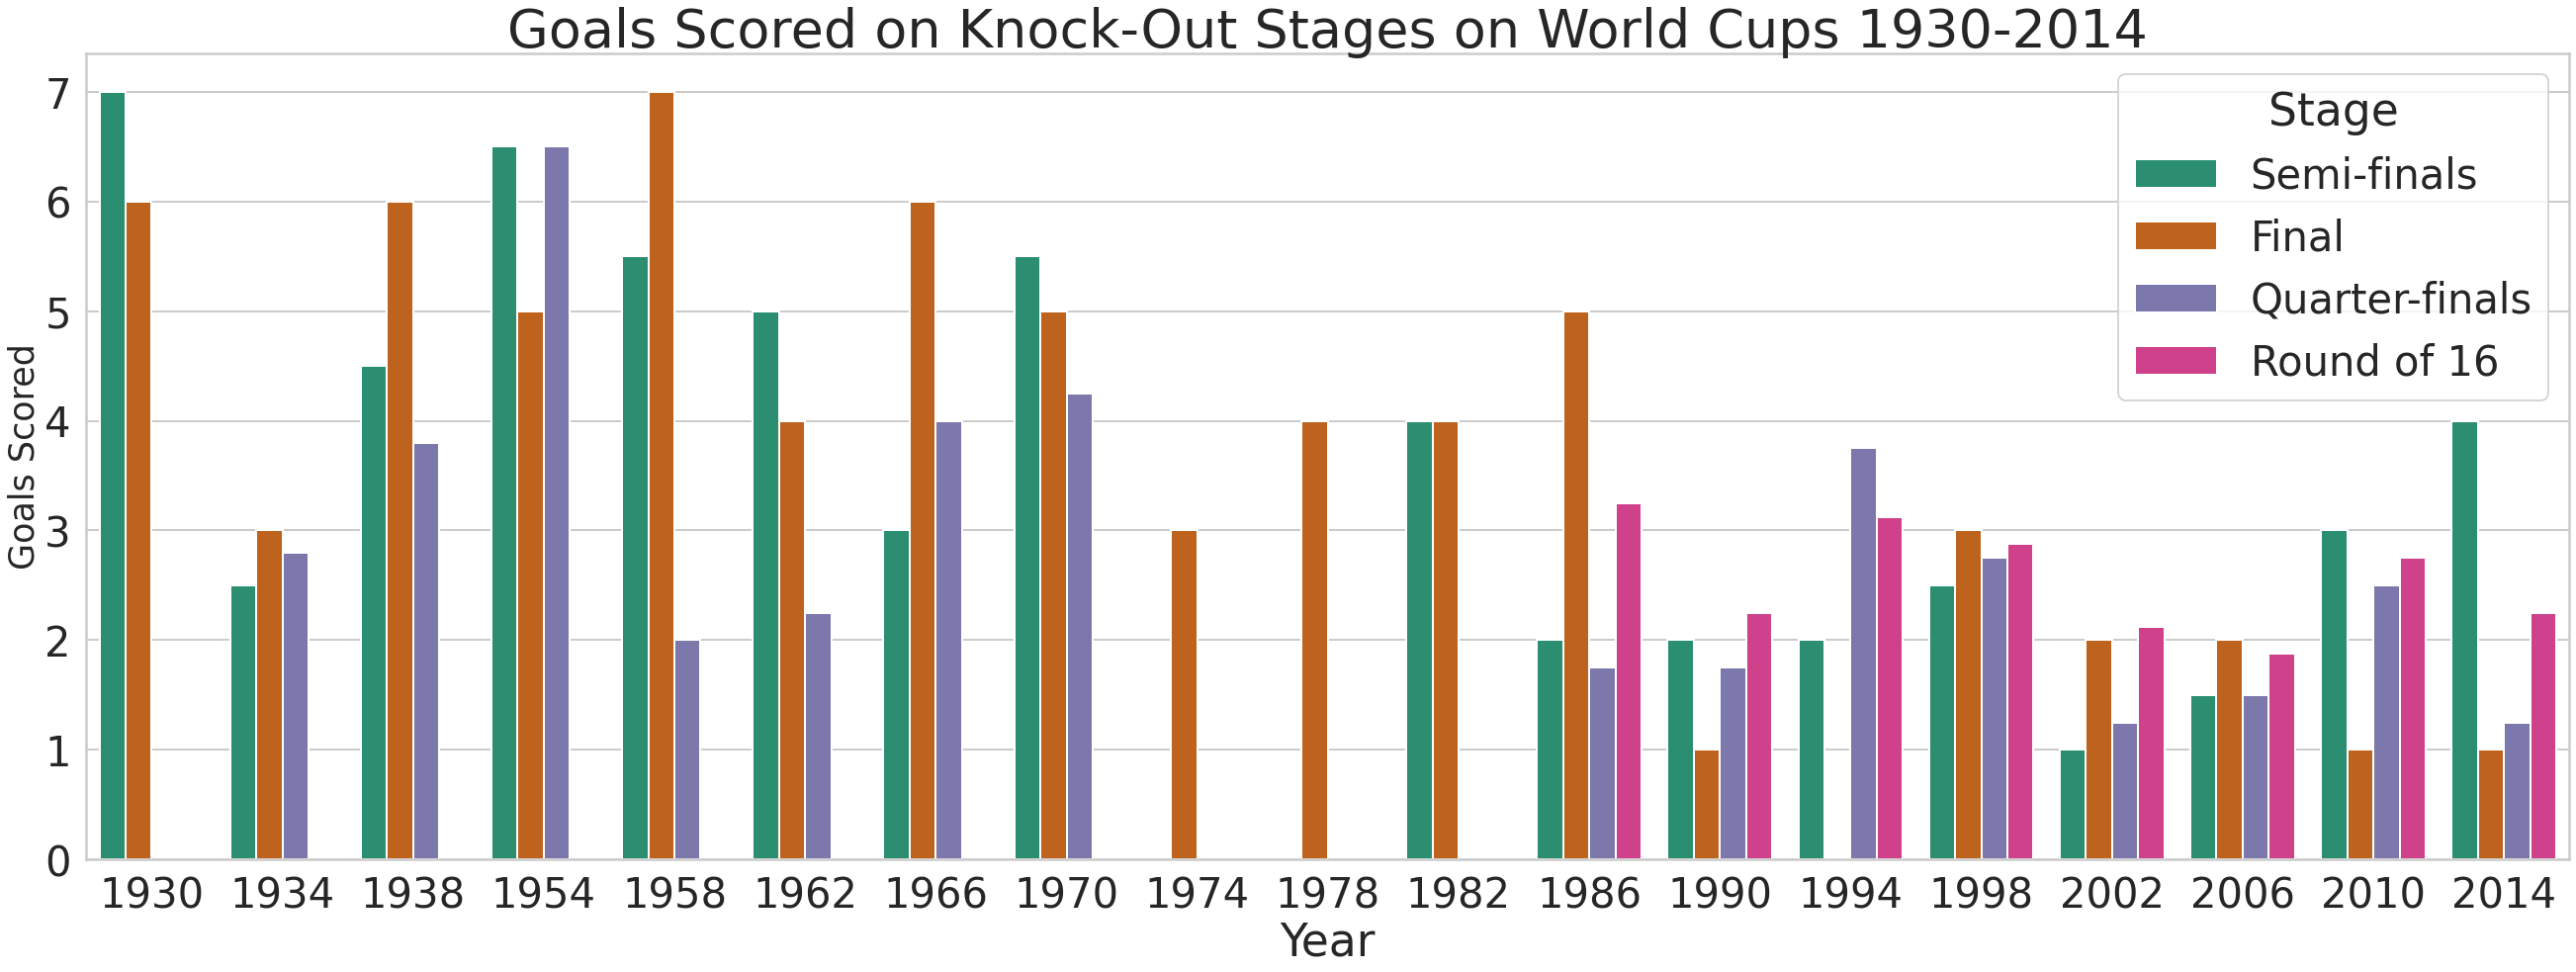
Figure 5: Goals Scored on Knock-Out Stages
Team Goals Analysis Throughout the World Cups
There are 79 different countries that have participated throughout the different World Cup Tournaments. In that sense, I created the function country_info, that takes as parameters a name of a country and a dataset and returns a DataFrame with the country information of its World Cup participations. This information is passed as a parameter to the plotting functions avg_goals_scored and total_goals_scored to be able to see visually the countries goals performance in its World Cup participations. Below Italy’s average goals per match and total goals scored per tournament can be seen.
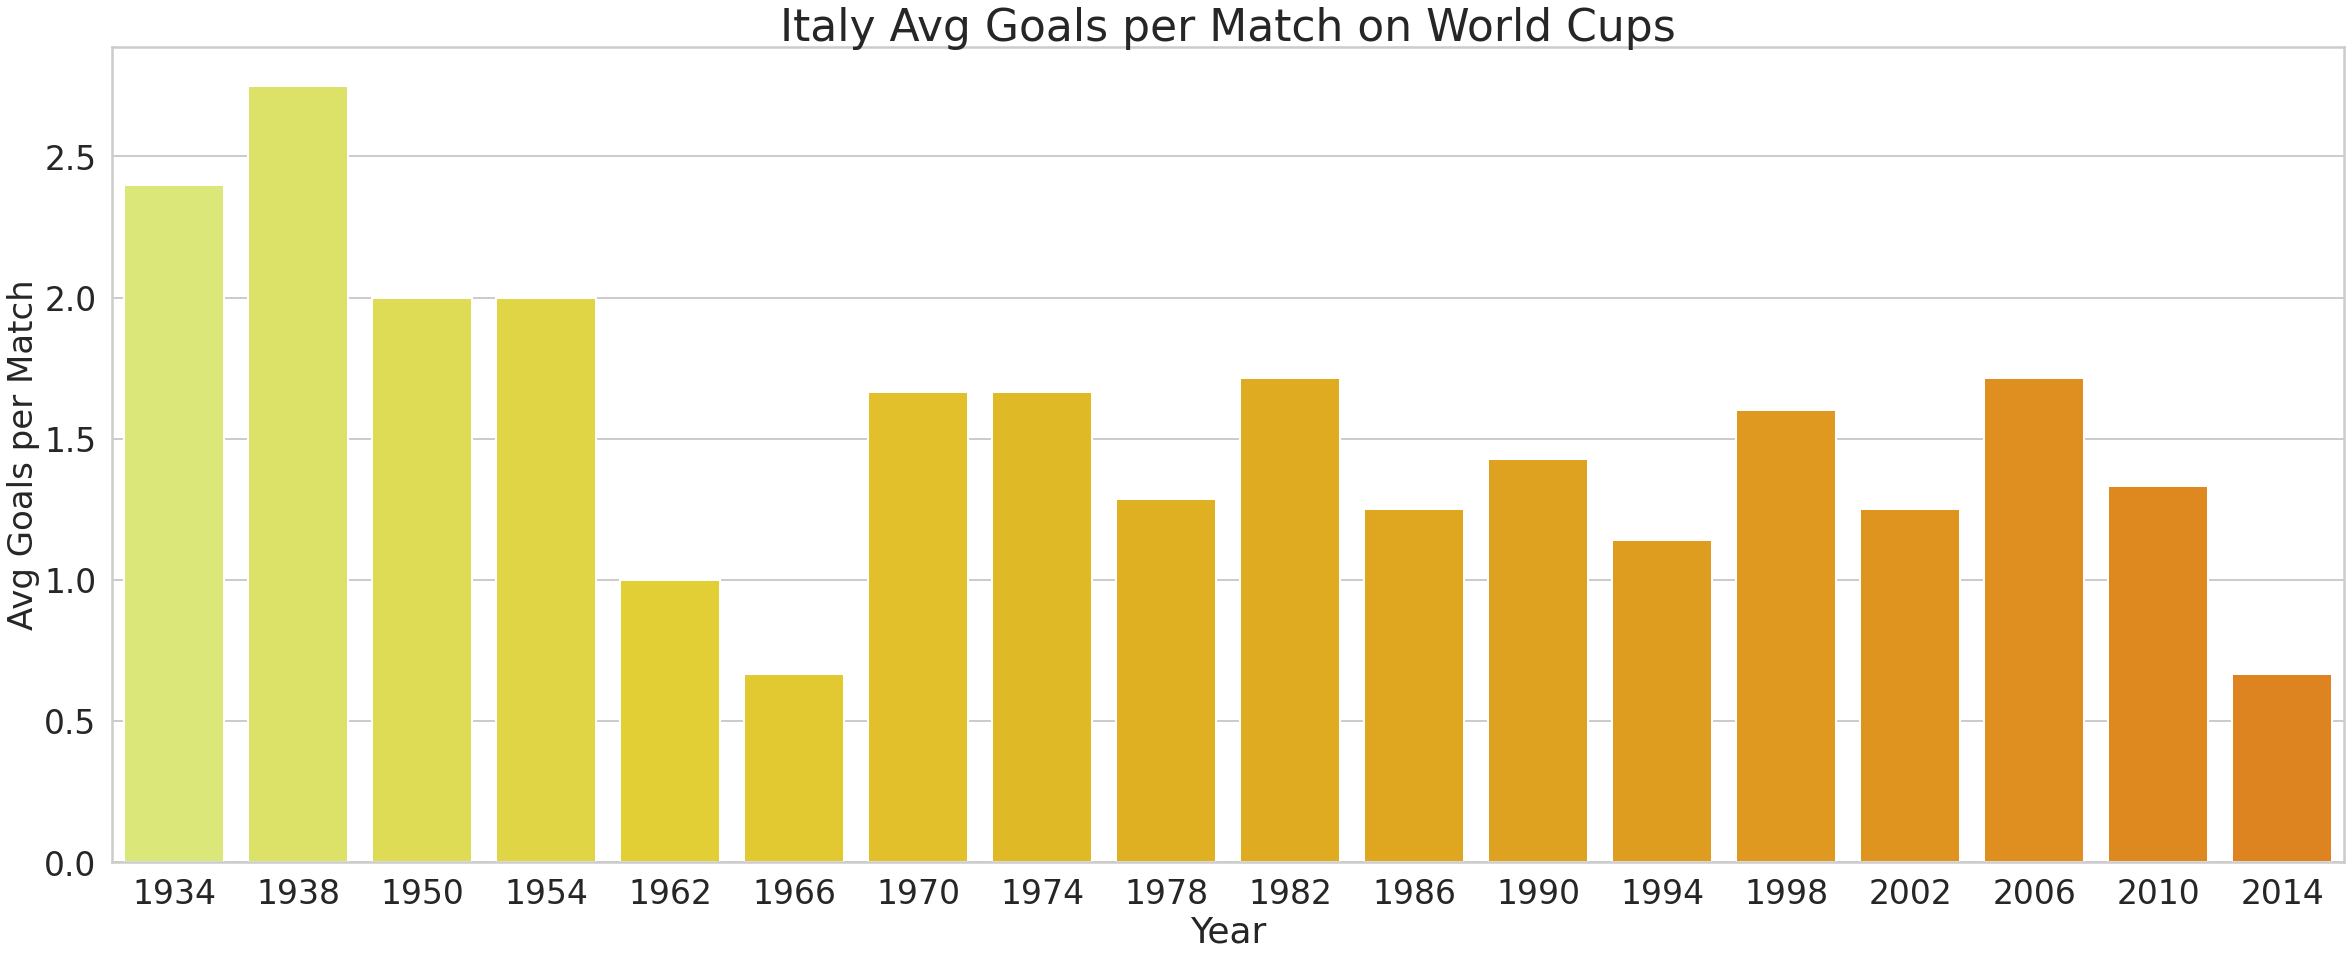
Figure 6: Italy Average Goals per Match
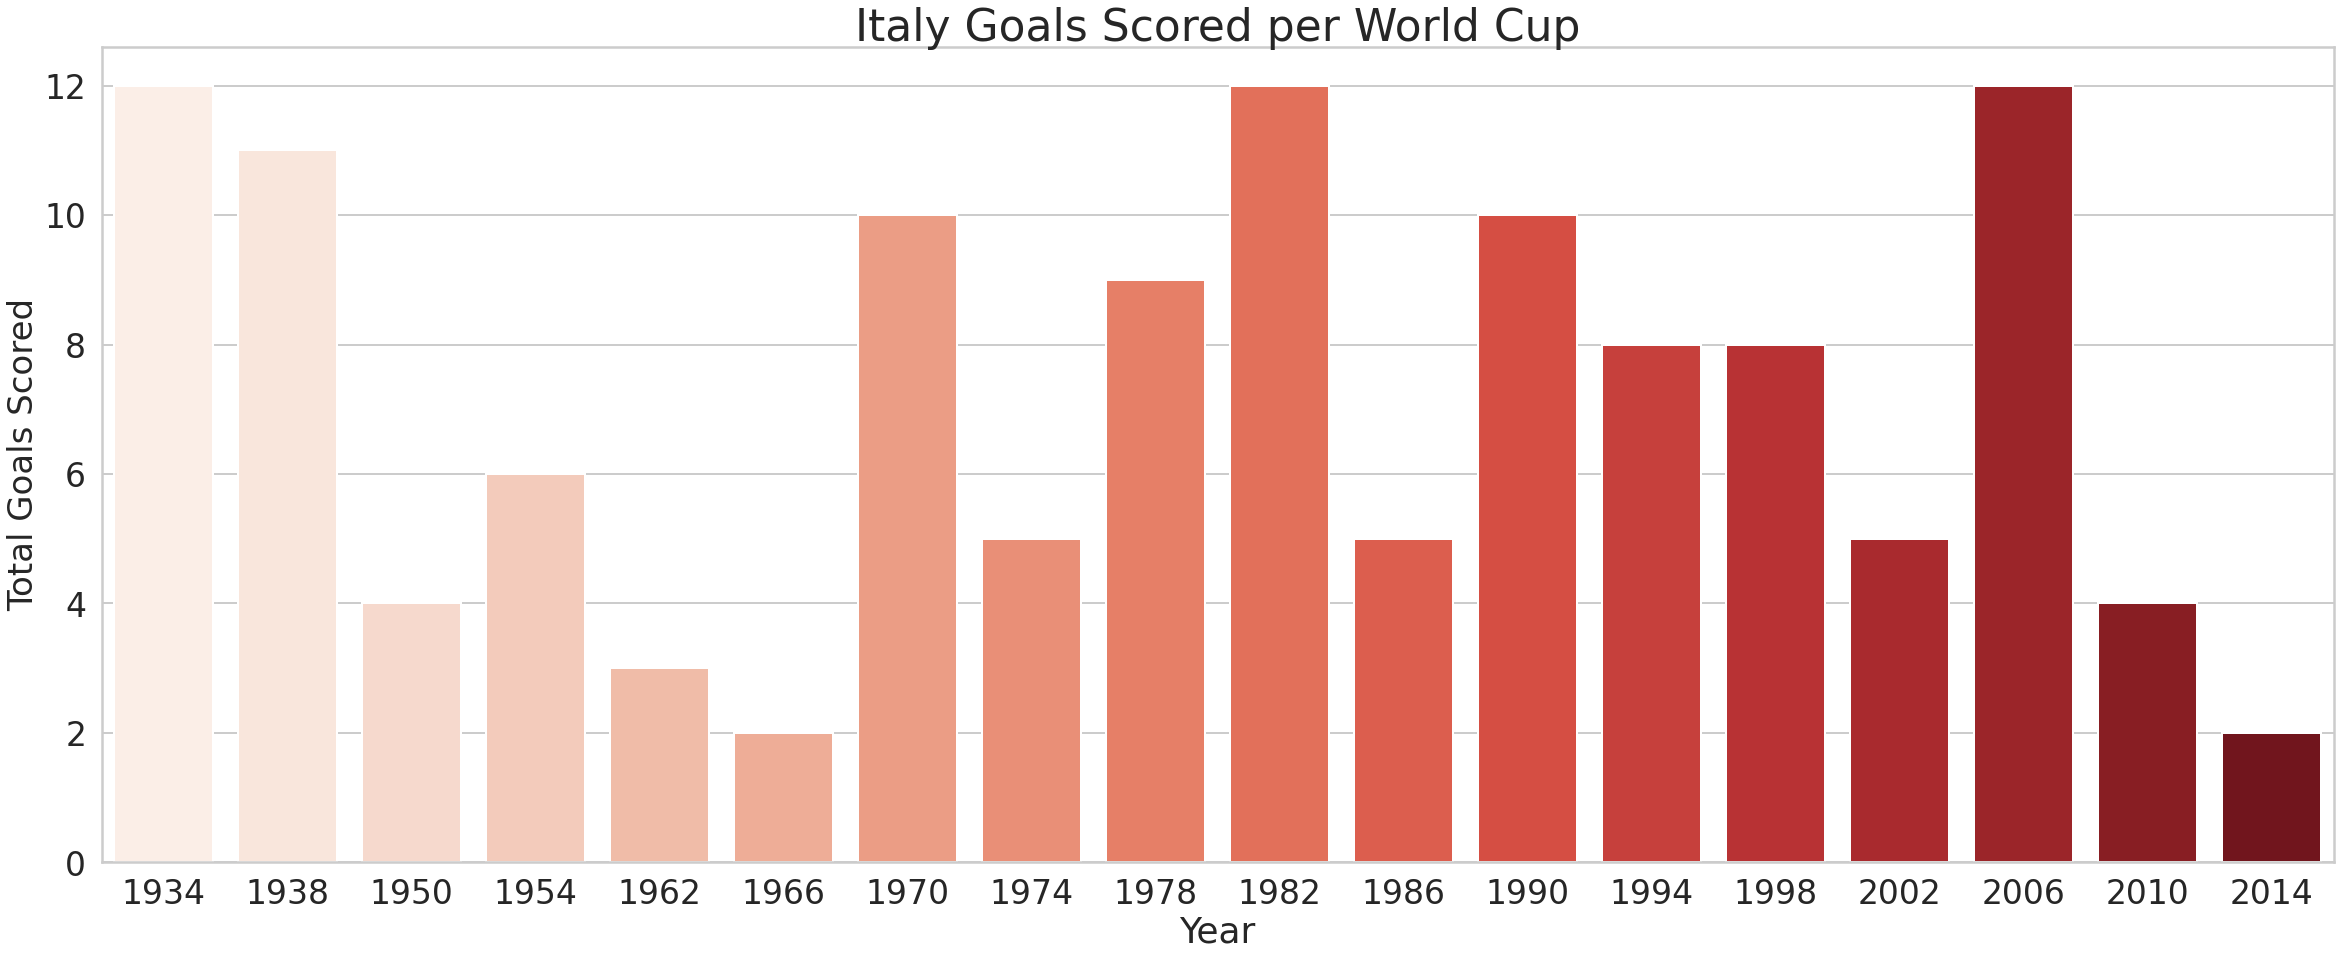
Figure 7: Italy Total Goals per World Cup
The highest number of goals scored by Italy in a World Cup was 12, it happened in the tournament of 1934, 1982 and 2006 with an average goals per match of 2.4, 1.7 and 1.7 respectively. One step behind with 11 goals is the tournament of 1938 with an average goals per match of 2.8, the highest record for Italy in all its participations. In all these years Italy was crowned as the World Champion. On the other hand, its worst scoring records were in 1966 and 2014, 2 goals scored and an average of 0.7 goals per match, followed by 1962 with 3 goals and an average of 1 goal per match and finally 1950 and 2010 end the list with 4 goals scored and average of 2 and 1.8 goals per match respectively. In all these years Italy was eliminated on the group stage. In that sense, there is a positive relationship between the numbers of goals scored and the overall standing at the end of the tournament. In the World Cups in which Italy scored the most goals it had a higher average goals per match which enable him to have a higher probability of advancing throughout the different stages of the tournament and reaching the final.