Analytics: Life Expectancy and GDP
For this project I analyzed data on the Growth Domestic Product (GDP) and Life Expectancy from the World Health Organization and the World Bank, to try and identify the relationship between the GDP and the life expectancy of six countries. GDP is the total monetary or market value of all the finished goods and services produced within a country’s borders in a specific time period. In that sense, being a broad measure of overall domestic production, it functions as a comprehensive scorecard of a given country’s economic health.
Throughout the project you will be able to find:
- Data cleaning and standardization.
- Analysis of Life Expectancy and GDP from 2000 to 2015.
- Correlation Analysis of Life Expectancy and GDP.
Datasets and Technologies Used
The analysis was done with a csv file from Kaggle ‘LifeExpe_GDP_data.csv’. It contains information of the Life Expectancy at birth in years and GDP by country during the period of 2000 to 2015
In terms of technologies, python was used for the data analysis with the following tools: pandas for data tyding and manipulation, numpy for numerical analysis matplotlib and seaborn for plots and graphs.
Data Analysis
Life Expectancy Over the Years
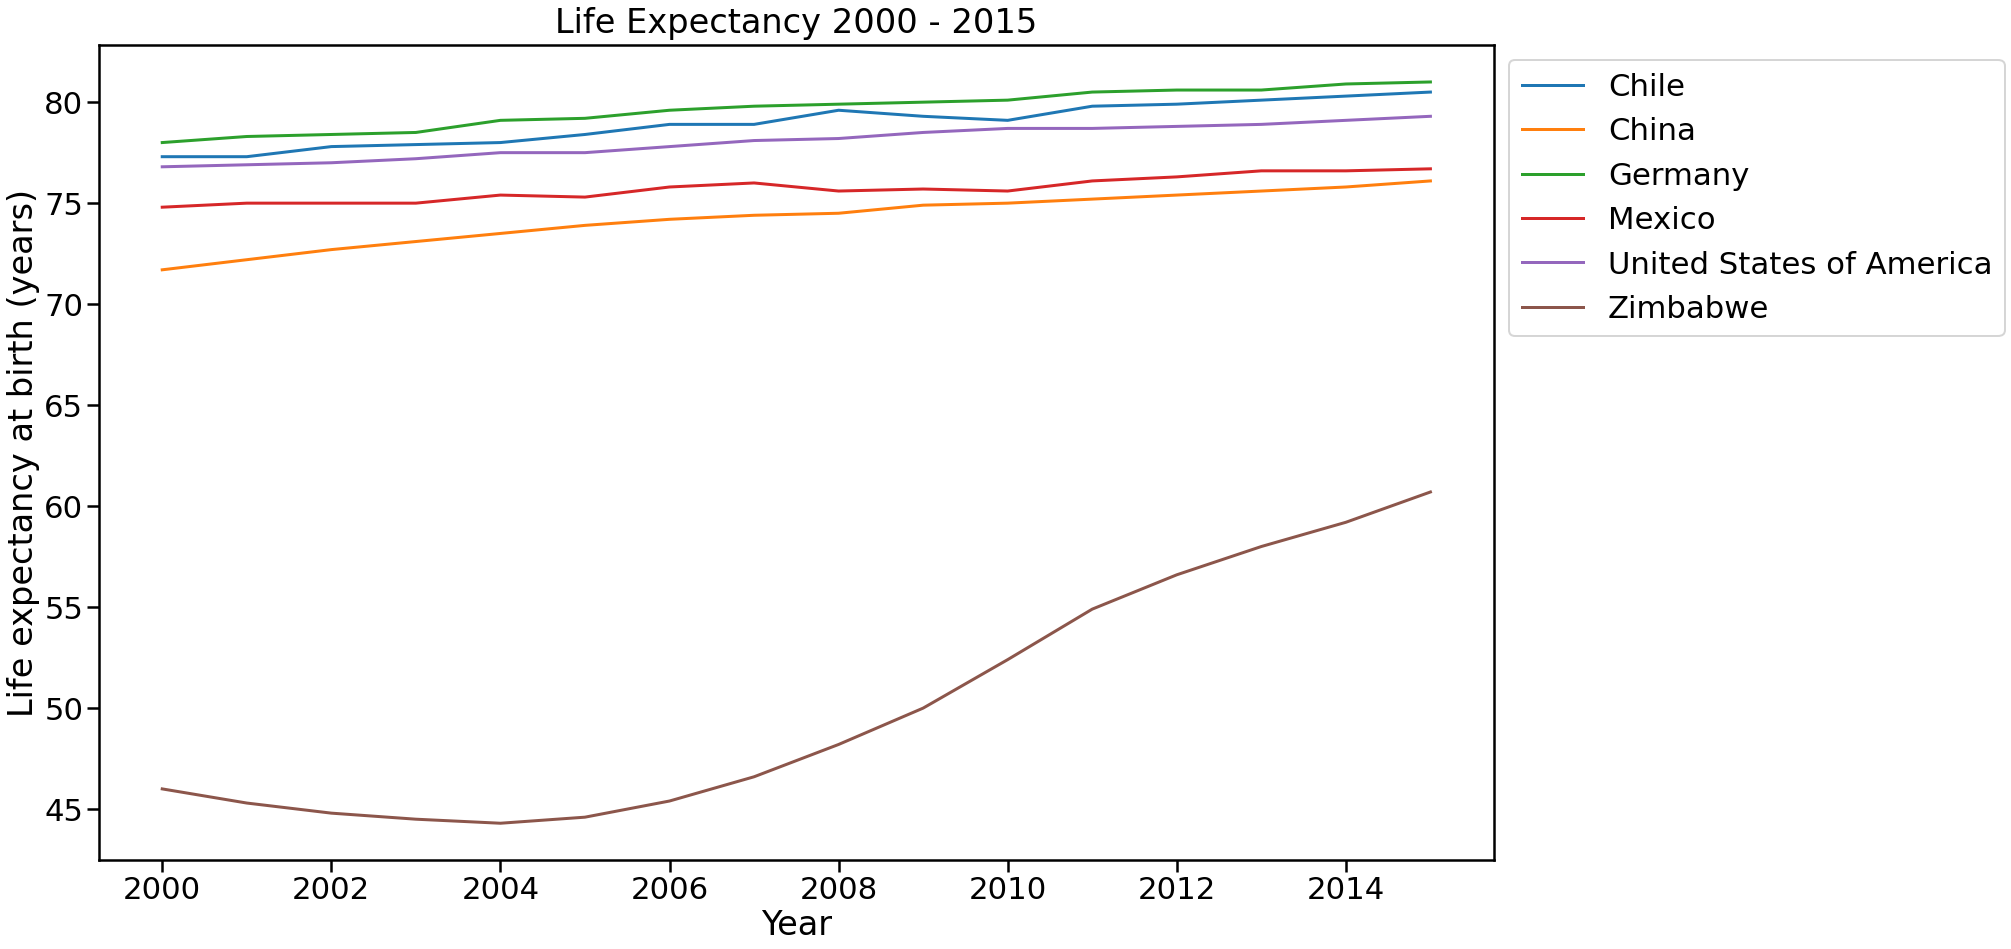
Figure 1: Life Expectancy 2000 - 2015
As can be seen in the figure above, Zimbabwe had the greatest change in life expectancy with a 29% increment in 15 years. In 2015 its population lived on average 14 years more than in 2000. On the other hand, Germany and Chile have increased 3.8% (4 years) and 4.5% (3 years) the average life expectancy of their population in 15 years. Finally, China passed from an average life expectancy in 2000 of 71 years to 75 in 2015 which translates, to an increment of 5.6%.
GDP Over the Years
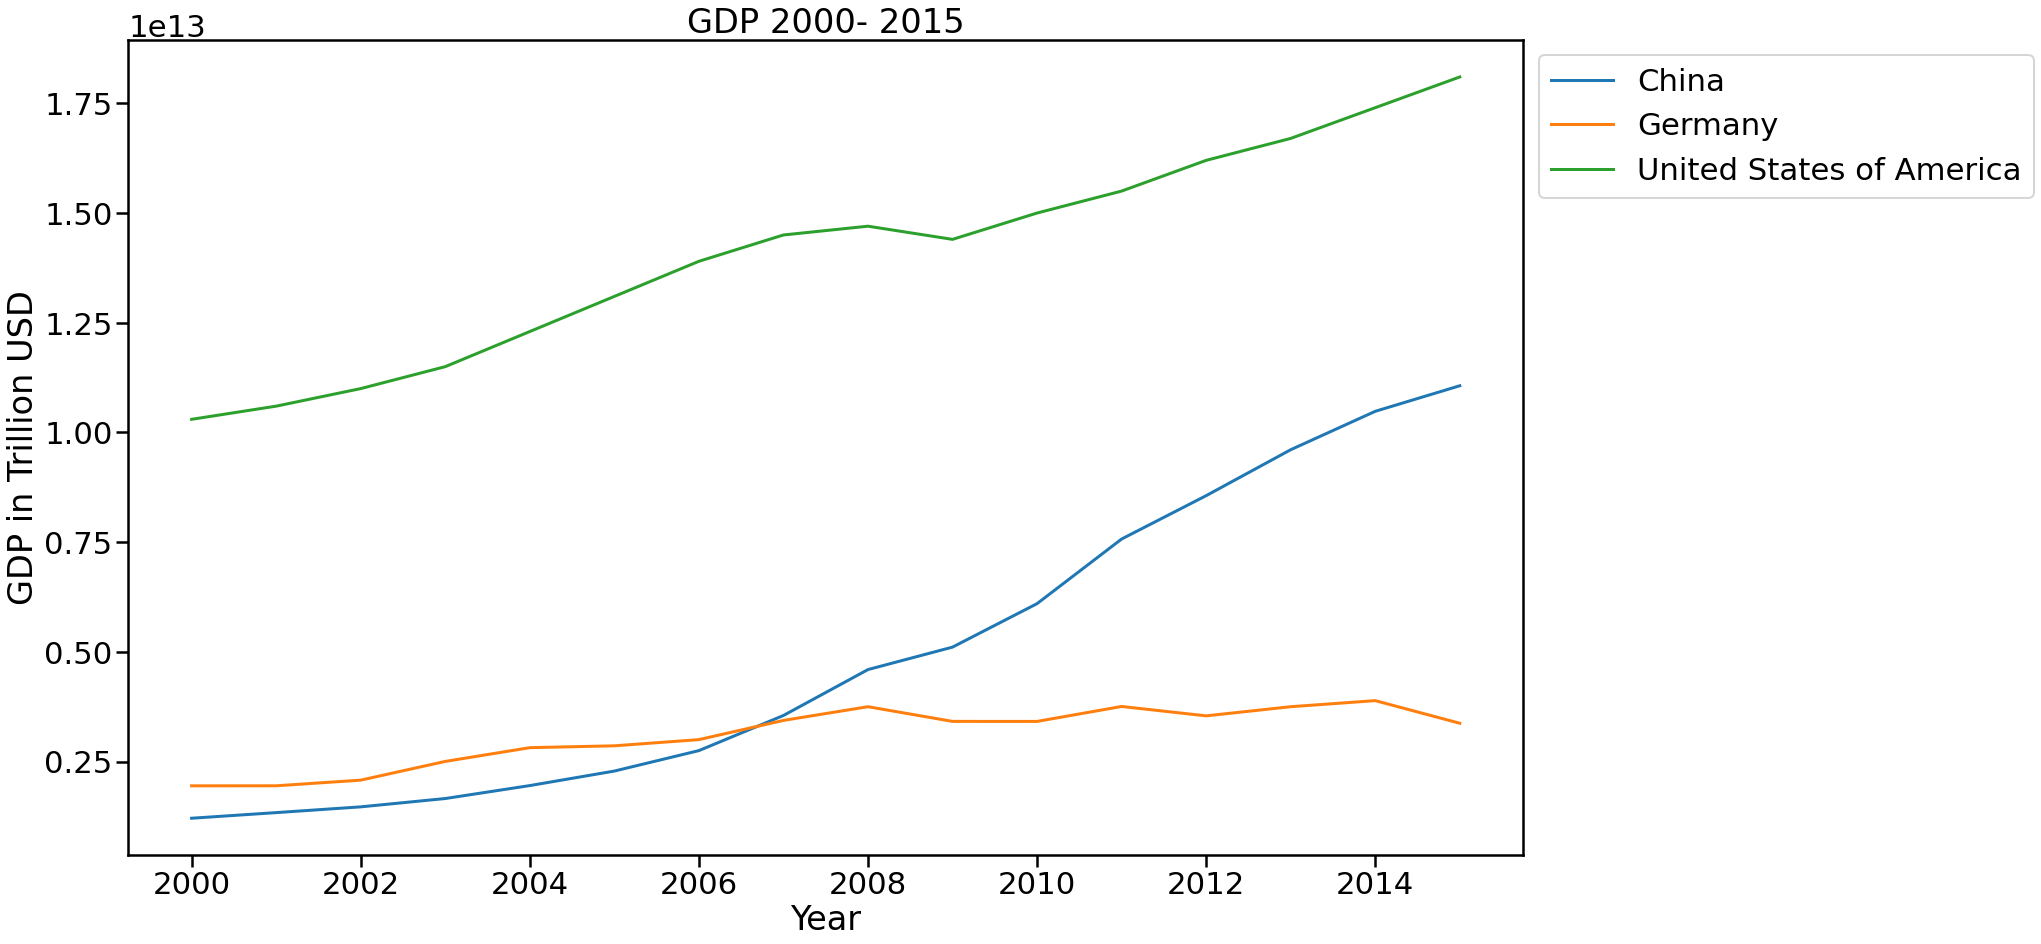
Figure 2: GDP of China, Germany and USA 2000 - 2015
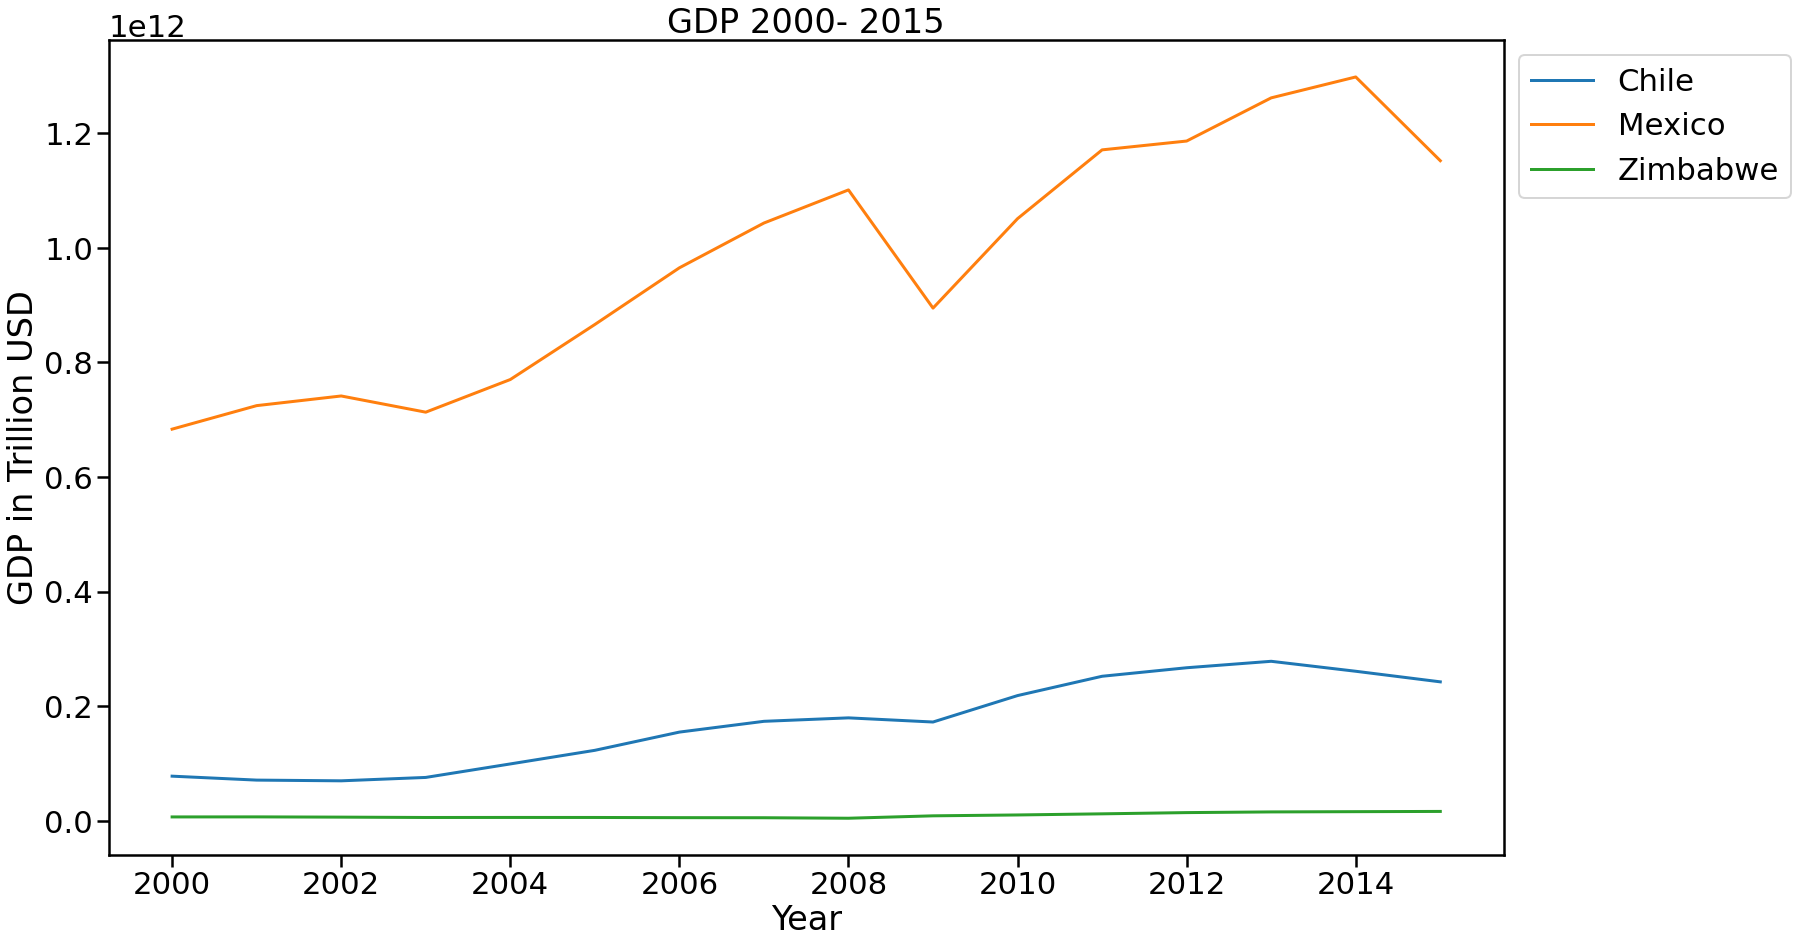
Figure 3: GDP of Chile, Mexico and Zimbabwe 2000 - 2015
Figure 2 and Figure 3 show the GDP in Trillion USD for China, Germany, USA, Chile, Mexico and Zimbabwe during the period of 2000 to 2015. USA has been the country with the highest GDP throughout the years analyzed. It has increased its GDP in 75% reaching its maximum in 2015 with 18 trillion USD. It only decline in 2009 due to the economic crisis it suffered in 2008 but, it started recovering at a steady pace during 2010 - 2012. It is also important to note that China had the biggest GDP increment during the period, 816%, passing from 1.2 trillion USD in 2000 to 11 trillion USD in 2015. Also, in 2008 it passed Germany’s GDP and positioned itself as the second country with the highest GDP behind USA.
Other important GDP growths to take into account are Chile and Zimbawe. Chile achieved a growth of 211% in its GDP passing from 7.7 billion USD in 2000 to 24 billion USD in 2015. Meanwhile, Zimbawe achieved a growth of 142% in its GDP passing from 6.6 billion USD in 2000 to 16 billion USD in 2015.
Life Expectancy Vs GDP
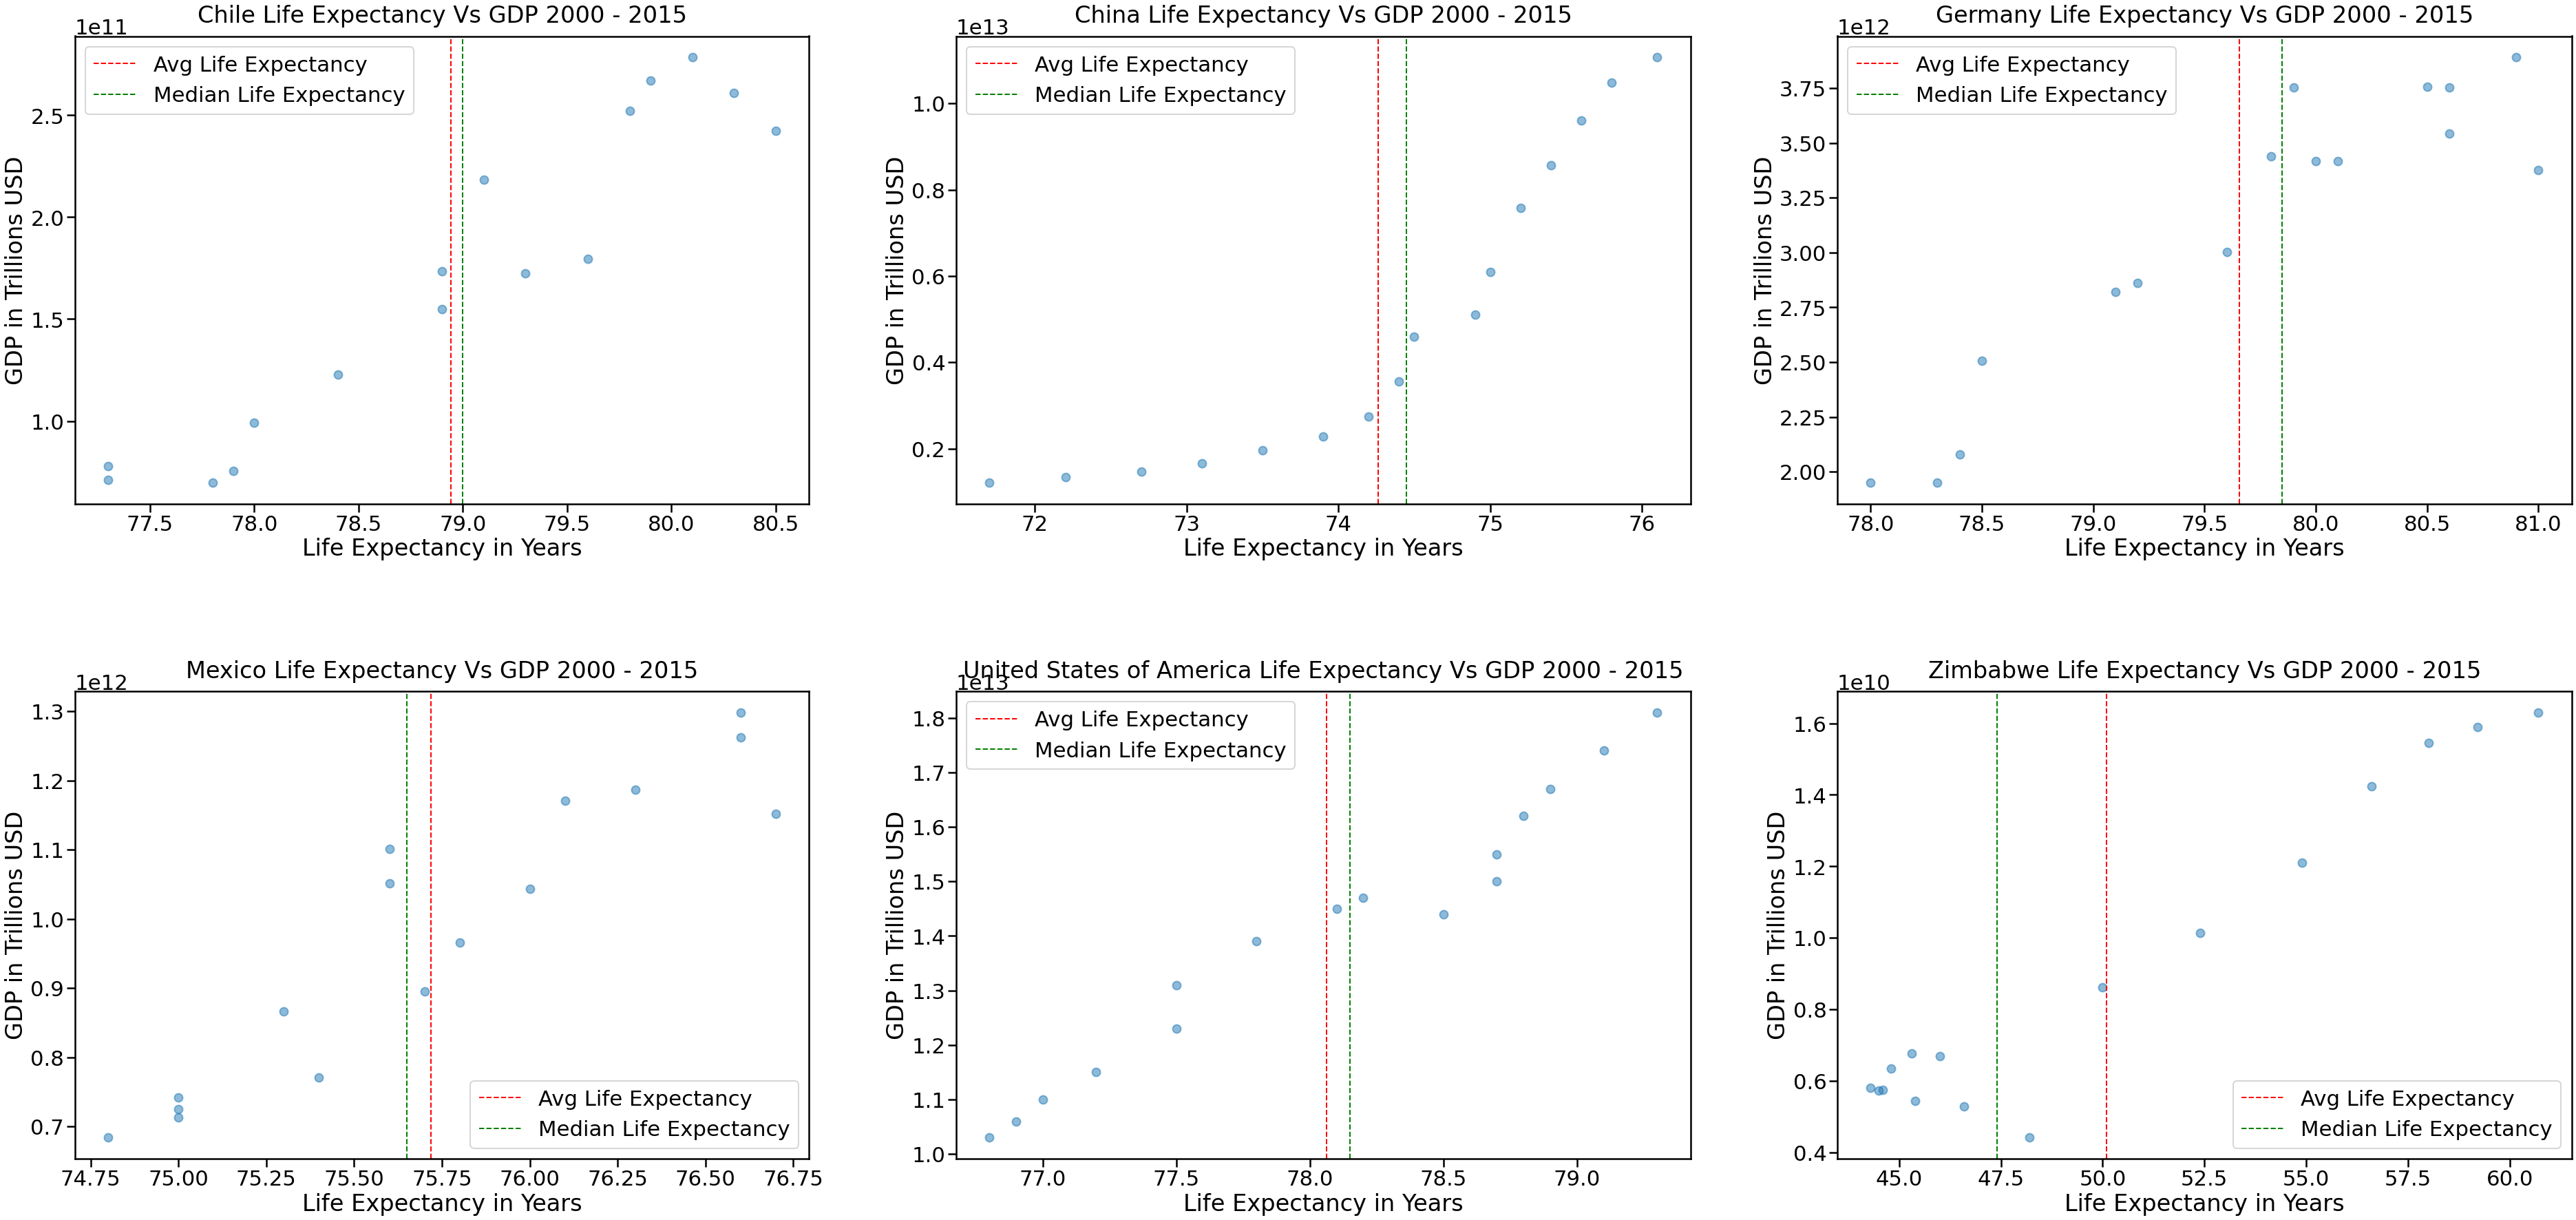
Figure 4: Countries Life Expectancy Vs GDP 2000 -2015
Figure 4 shows that all 6 countries (Chile, China, Germany, Mexico, United States and Zimbabwe) have strong positive linear relationships with correlation values greater than 0.9. That means, that as the GDP of a country grows the life expectancy in years of its population will also increase. The correlations of Life Expectancy Vs GDP per country can be seen below:
- Chile: 0.94987
- China: 0.90852
- Germany: 0.93269
- Mexico: 0.93223
- United States: 0.98170
- Zimbabwe: 0.96619
With that in mind, Germany has the highest life expectancy with its population living on average 79.6 years. On the other hand, Zimbabwe has the lowest life expectancy with its population living on average 50 years. The lowest correlation between Life Expectancy and GDP is seen on China (0.90852). One of the reasons for this behavior is, that China is the country with the highest population and 35.9% of its 1.3 billion inhabitants lives below the poverty line.
In that sense, since GDP is the monetary value of all finished products and services done in a country in a specific period of time, as the GDP increases the country will have more economic assets to invest in the wellbeing of its inhabitants like in health services, job opportunities, quality of life, etc… At the end, this allows the population to live longer.