Analytics: Endangered Species in United States National Parks
For this project I analyzed data from the US National Parks Service about endangered species in different parks. Taking the role of a biodiversity analyst, the goal is to ensure the survival of at-risk species to maintain the level of biodiversity within the parks. In that sense, I will identify if there are any patterns in the types of species that become endangered and their relationship to the National Parks.
Throughout the project you will be able to find:
- Data cleaning and standardization.
- Distribution of observations by park.
- Count of observation status by category.
- Are certain types of species more likely to be endangered?
- Are differences between species and their conservation status significant?
Datasets and Technologies Used
The analysis was done with a two csv files from Kaggle ‘observations.csv’ and ‘species_info.csv’. ‘observations.csv’ contains information of the number of times a given specie was observed on a specific national park while, ‘species_info.csv’ has the specie, the scientific name and the common name of all animals sighted.
In terms of technologies, python was used for the data analysis with the following tools: pandas for data tyding and manipulation, numpy for numerical analysis matplotlib and seaborn for plots and graphs and scipy.stats for statistical analysis.
Data Analysis
Distribution of Observations per National Park
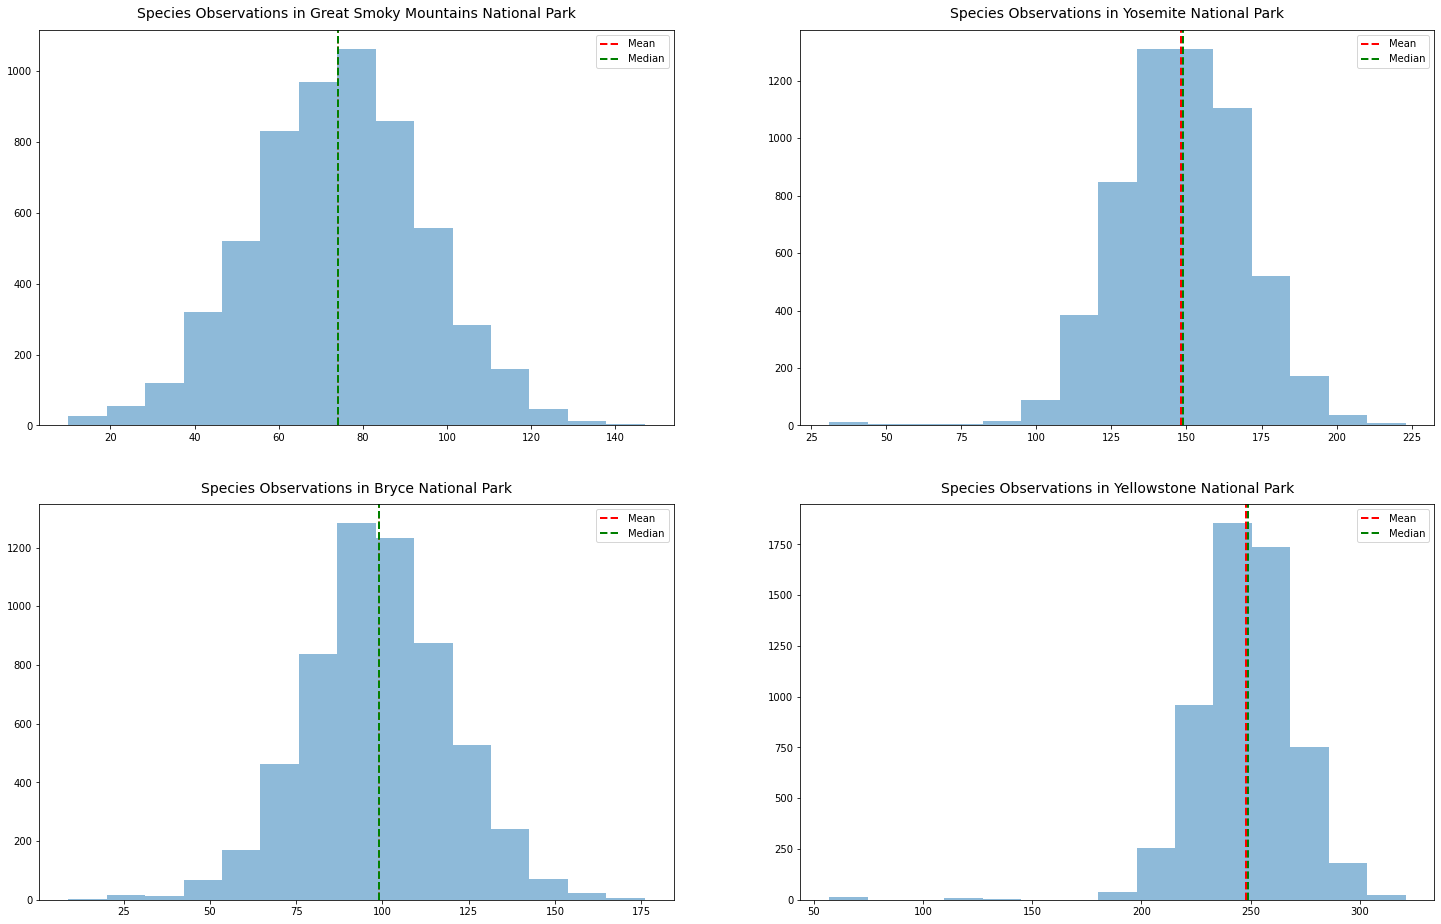
Figure 1: Species Observation per National Park
The distribution on the upper left corner of Figure 1 shows species observations in Great Smoky Mountains. It is an unimodal symmetric distribution with a mean and median of 74.14 and 74.0 respectively, meaning, that on average when observations are made 74 species are seen. The upper right corner shows the distribution of species observations in Yosemite National Park. It is an unimodal distribution with mean 148.24 and median 149.0 that means, that when observations are done on this park on average 148 species are seen.
Moving forward, the distribution on the lower left corner shows species observations in Bryce National Park. It is an unimodal symmetric distribution with a mean of 98.91 and a median of 99.0, meaning, that when observations are made 99 species are seen. Finally, the distribution in the lower right corner shows species observations in Yellowstone National Park. It is an unimodal distribution with a mean of 247.86 and a median of 249.0 that means, that when observations are done on the park 248 species are seen.
Count of Observation Status by Category
First its important to note, that there are four different conservation status an endangered species can be categorized into. Species of concern are species that are declining in its population or appear to be in need of conservation. Threatened, are species that are vulnerable to be endangered in the near future while Endangered, are species that are currently at a serious risk of becoming extinct. Finally, In Recovery are species that are formerly endangered but, currently are not in danger of extinction throughout all or a significant portion of its range.
With that in mind, the count of species by conservation status and the count of species in conservation status by class in Great Smoky Mountains, Yosemite, Yellowstone and Bryce National Parks is as follows:
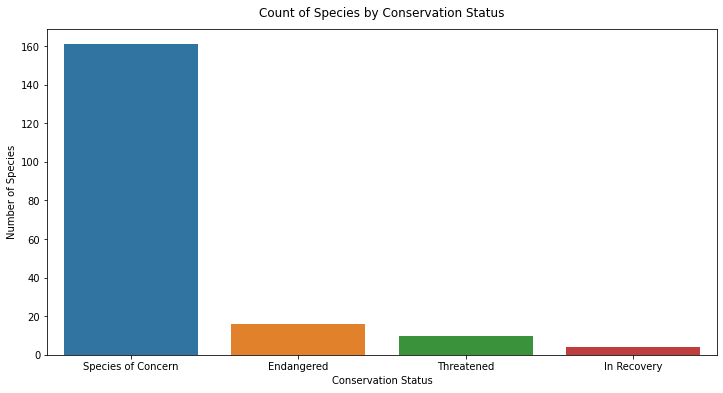
Figure 2: Count of Species by Conservation Status
Figure 2 shows that there are 191 species in conservation status. 84.3% (161) of them are in the species of concern category meaning that, these are the species in which the park protectors should focus their efforts to avoid them from becoming threatened or endangered. On the other hand, 16 species (8.3%) are in endangered status, 10 species (5.2%) are in a threatened category and 4 species (2%) are in recovery status.
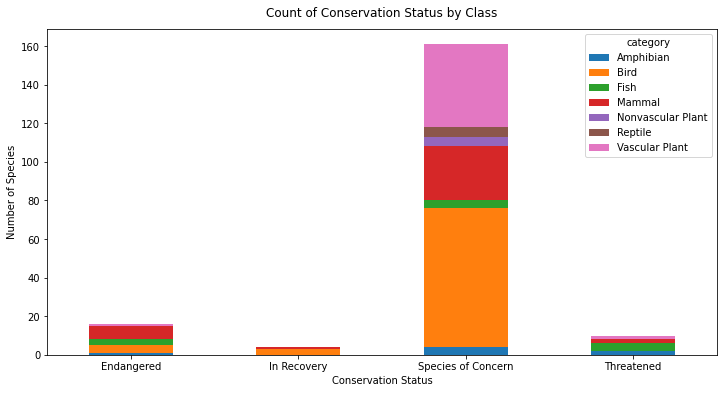
Figure 3: Count of Conservation Status by Class
Complementing with what was stated previously, Figure 3 shows the number of species by class in each conversation status. Taking into account that 84.3% of the 191 species in conservation status are in the species of concern category, 44.7% of them are birds, 26.7% are vascular plants, 17.4% are mammals, 3.1% are reptiles, 3.1% are non-vascular plants, 2.5% are amphibians and 2.5% are fish. On the other hand, Mammals are the class that is most endangered and threatened.
Are certain types of species more likely to be endangered?
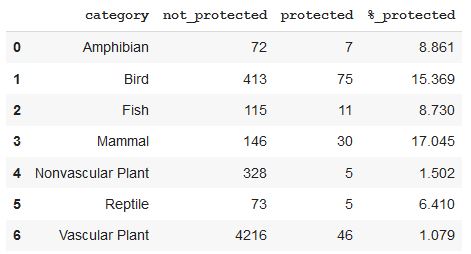
Table 1: Status of Protection by Category
Table 1 shows the percentage of each category that is under protection in Great Smoky Mountains, Yosemite, Yellowstone and Bryce National Parks. Mammals are the animals that are more protected with 17.045% of its population under this status, followed by birds that have 15.369% of it population under protection. Fish and Amphibians continue the list with 8.861% and 8.730% of their population under protection. On the other hand, Vascular Plant is the category with the least number of its population being protected, just 1.079% from its 4216 population.
Are differences between species and their conservation status significant?
A Chi-Square test was ran to determine if different species have statistically significant differences in conservation status rates. chi2_contingency from the scipy.stats module and a significant threshold of 0.05 was used to run the test. In that sense, the contingency table for Mammals and Reptiles is the following:
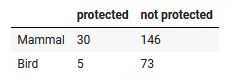
Table 2: Contingency Table of Mammals and Reptiles
Our hypothesis for the test are:
- H0: No association between Mammals and Reptiles conservation rates.
- H1: There is an association between Mammals and Reptiles conservation rates.
The expected values if there was No association are:
- [[24.2519685 151.7480315], [10.7480315 67.2519685]]
After running the Chi-Square test a P-Value of 0.038835 is obtained. In that sense, we can conclude with a 95% confidence that there IS an association between mammals and reptiles conservation rates. Mammals are shown to have a statistically significant higher rate of needed protection than reptiles.